Using Claude AI to make a Google Reader like app.
Mermaid
I was told by a JD Long at a recent conference where I brought up Code2Flow that Mermaid could be used just like Code2Flow within R/Github/etc to draw flowcharts, but it also has other functions that makes it a more generally useful program. Thanks James!
Mermaid is also accessible within R Studio so I can try it here.
Mermaid Live Editor at https://mermaid.live/edit#
Simple Mermaid diagram In R Studio, DiagrammeR would be the package to install for producing Mermaid graphics.
[Read More]
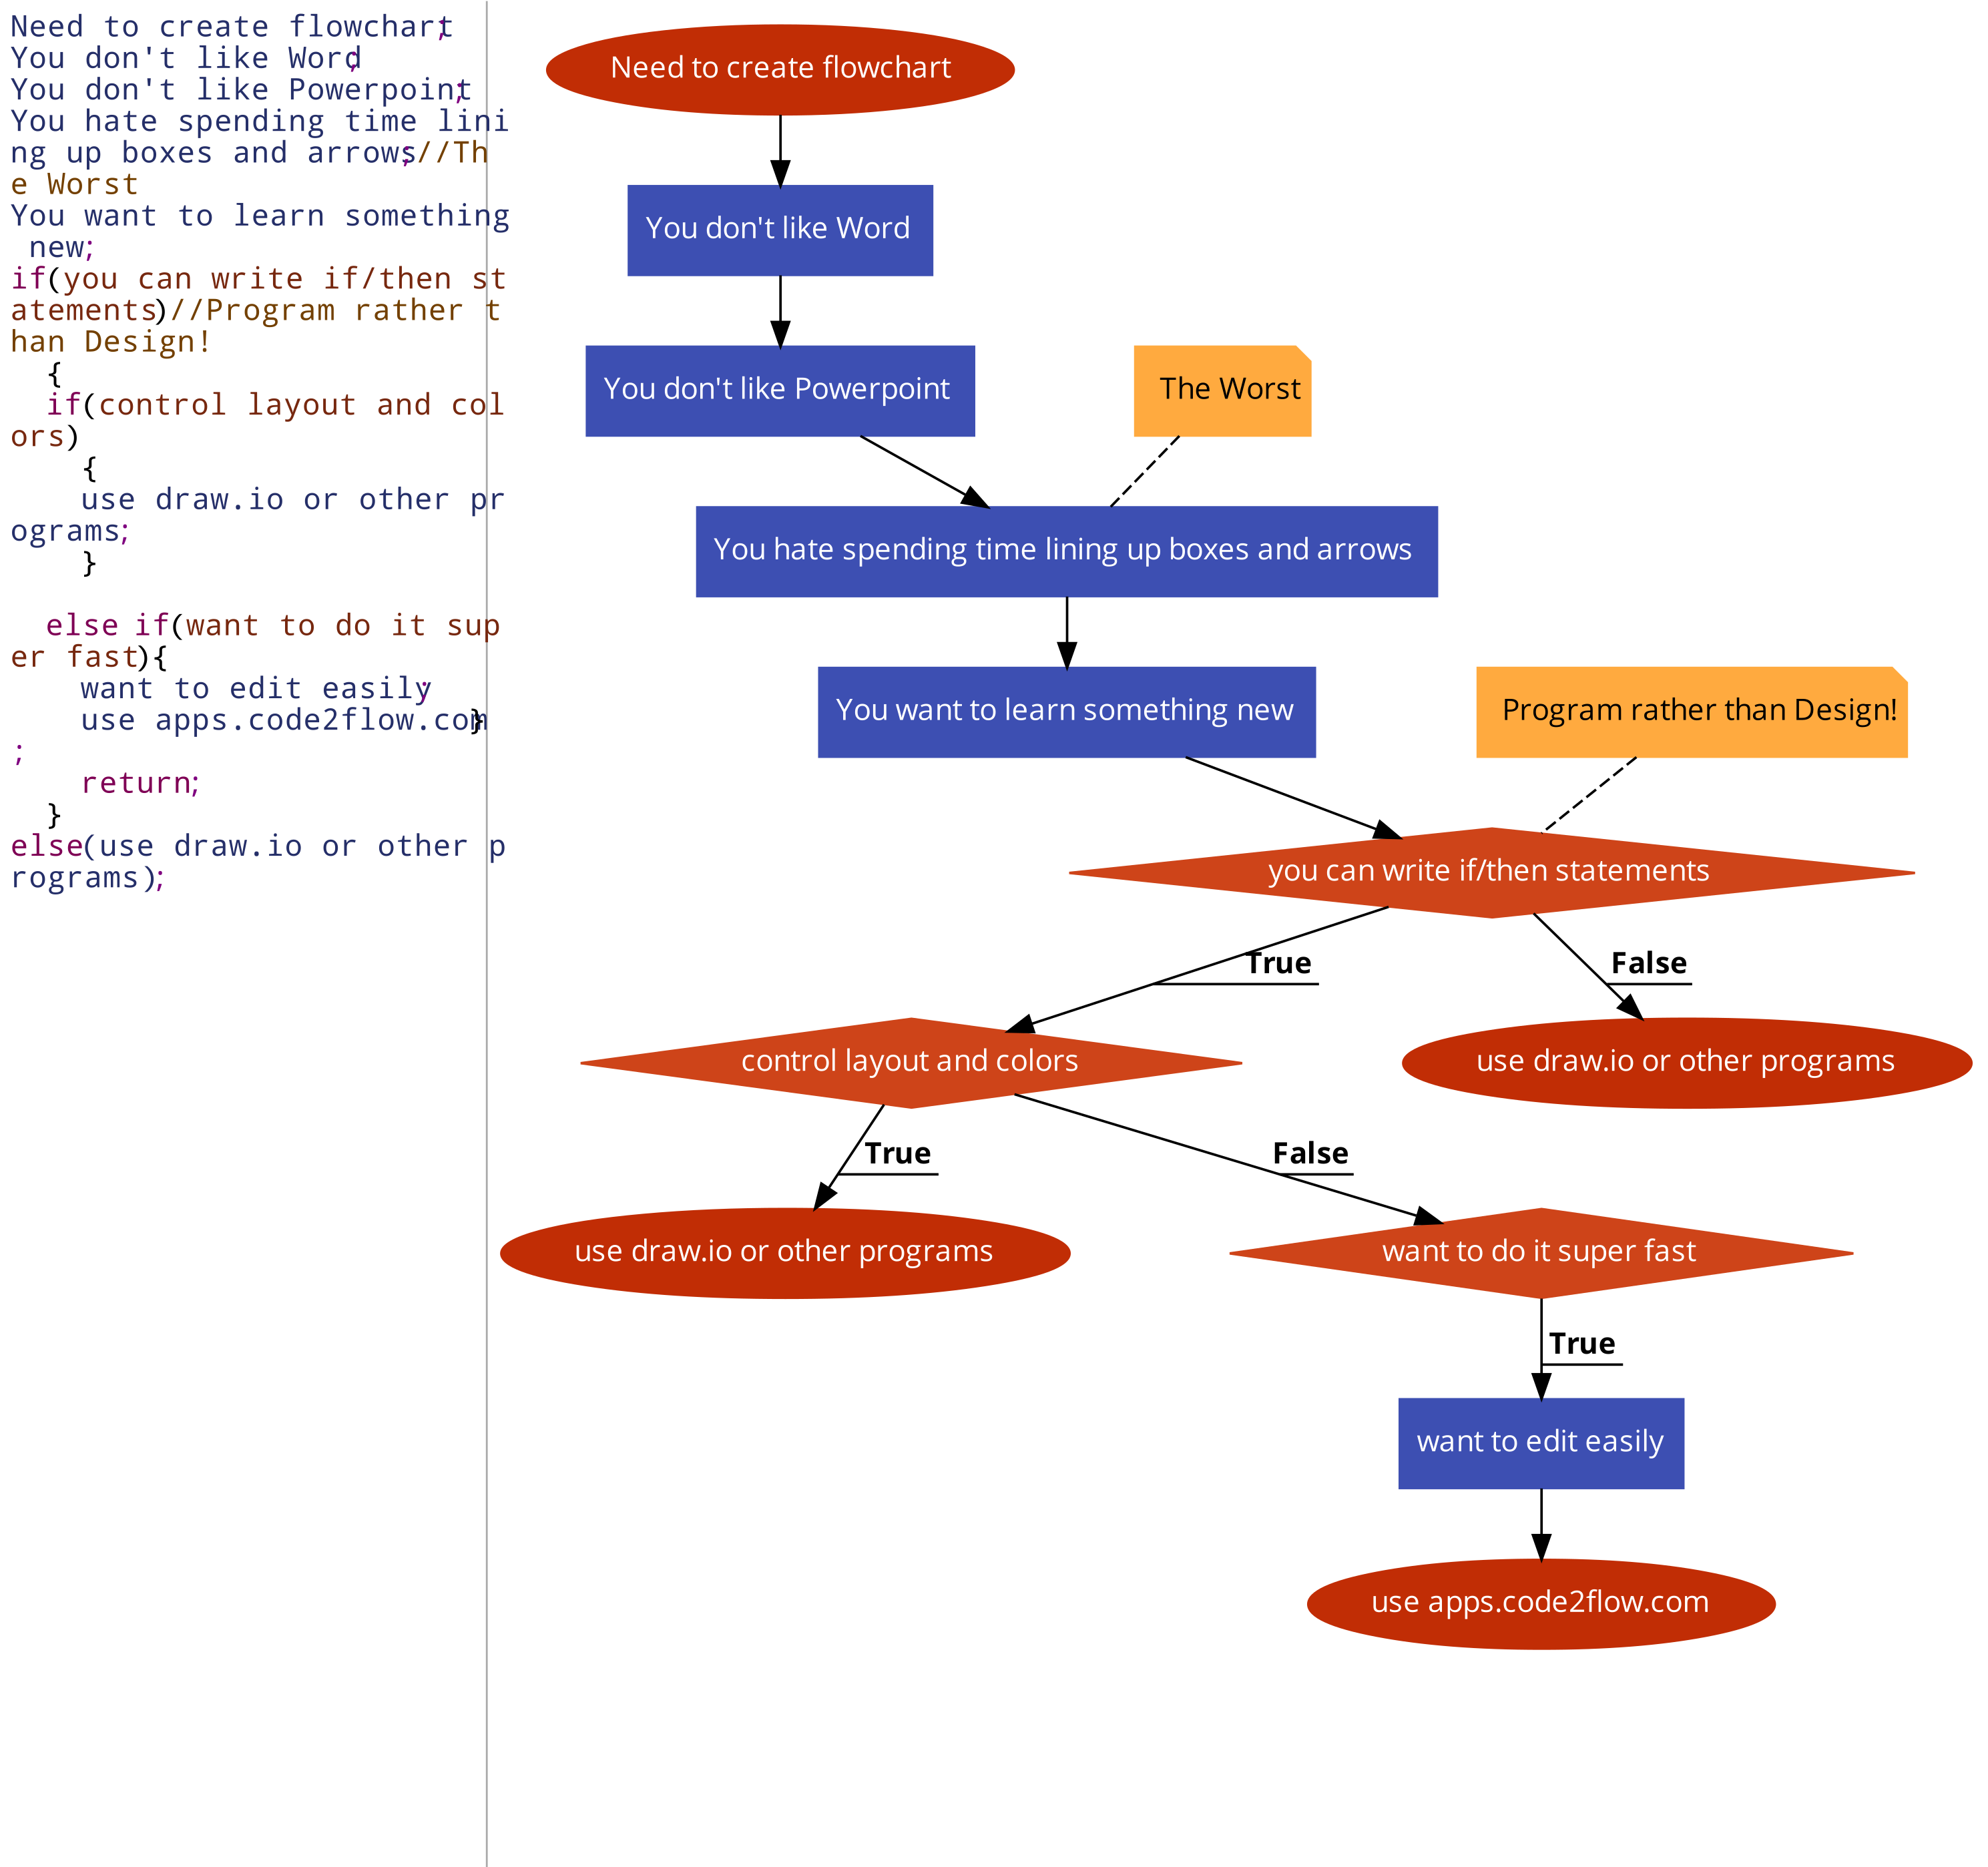
Code2Flow
Site to programmatically design flow charts. https://app.code2flow.com/
I even made a flowchart to see if it’s right for you!
Perry Mehrling
Perry Mehrling Lectures
Bagehot: Lend freely at high rates against good security.
Mehrling: How the fed became the dealer of last resort. We do need central banks.
Banking runs are immediate problems of liquidity and not necessarily of solvency.
ChatGPT Shiny R app
This is a simple integration of ChatGPT into shiny R. At first I wanted to do this in Python but it was easier to do a web app in R Shiny. I used code from this site to get started:
https://www.listendata.com/2023/05/chatgpt-in-r.html#steps_to_run_chatgpt_in_r
The app is hosted at: https://twong.shinyapps.io/chat_bot/
The R code for this shiny app is below.
library(shiny) library(httr) ui <- fluidPage( titlePanel("ChatGPT Shiny App"), textInput("user_input", "Enter your message:"), actionButton("submit_btn", "Submit"), p(""), textOutput("chat_output"), p(""), p("Code for this page is at https://codelooper.
[Read More]
Kuminga Dunks
Distribution fitting
This page is made using code from: https://github.com/semanzi/fitting_distributions_with_R_NHSR_2021/tree/main
The app is hosted at: https://twong.shinyapps.io/HSMA_distr_tool/
ChatGPT python code for distribution fitting
I asked ChatGPT for some python code to do distribution fitting and this is what it provided. I think I needed to edit it to fix some errors but it’s a nice solution.
First, I wanted to put in some R code that will allow me to display the results in blogdown, which is what I’m using to post to this site.
library(knitr) library(reticulate) knitr::knit_engines$set(python = reticulate::eng_python) The following python code was used for distribution fitting.
[Read More]
Copula Example
Trying an introduction to copulas exercise, from (R-excerises), using the dataset (https://www.kaggle.com/datasets/gtouzin/samplestocksreturn)
Exercise 1 We’ll start by fitting the margin. First, do a histogram of both Apple and Microsoft returns to see the shape of both distributions.
returns <- read.csv("returns_00_17.csv") hist(returns$Apple) hist(returns$Microsoft) Exercise 2 Both distributions seems symmetric and have a domain which contain positive and negative values. Knowing those facts, use the fitdist() function to see how the normal, logistic and Cauchy distribution fit the Apple returns dataset.
[Read More]
Random Number Generator
I wanted to generate a set of random numbers without resorting to the rand() function in excel. I didn’t want results to change each time I opened the file but I wanted a way to seed different values when needed. I found this paper by Michael Lampton, Space Sciences Lab, UC Berkeley:
https://research.ssl.berkeley.edu/~mlampton/RandomSpreadsheet4.pdf
The paper has a formula for producing a set of random values using a modulus function on a large number while maintaining portability of such randomly generated numbers between different software and hardware platforms.
[Read More]